{ Description }
The Viewer allows you to view your tracked sessions one at a time or as a compilation of several sessions in several different views. You can also export or print your data or graphs.
Much like the session recorder, the Viewer requires the configuration file in order to view any recorded behavior. So the first thing it will ask for is a configuration file before it starts. Once you specify a configuration file, you may view recorded events files that were recorded using that configuration template.
Index:
{ Main Form }
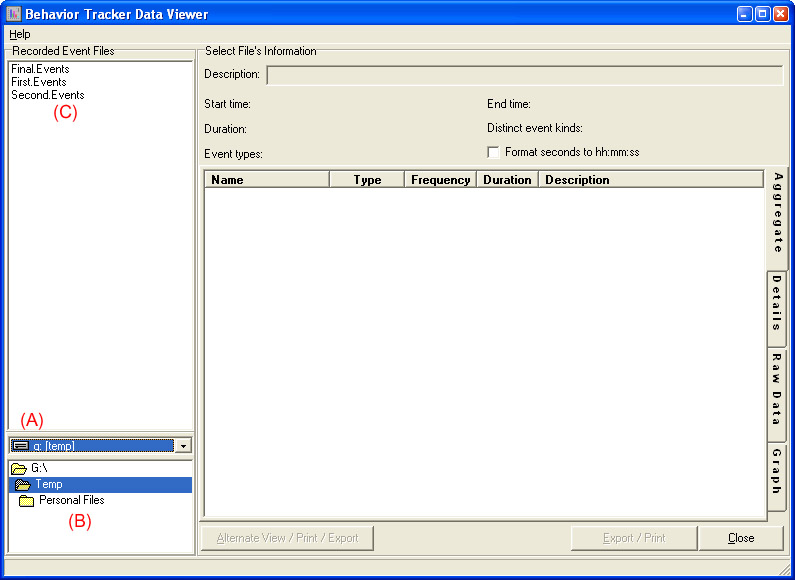
A) Using this drop down, select the drive where your event files are saved.
B) Given the drive selected at (A), now you can maneuver through the folders to the folder holding your recordings.
C) As you change folders and drives, the list of Events files refreshes in this area. When you reach the file(s) you wanted to view, click & select a file name here to see its information on the right hand side.
IMPORTANT: You can multi-select more than one file to view at the same time using normal windows selection methods. To select a range, select the first file in the range, hold down the SHIFT key, and click the last one in the range. To select and unselect without changing the rest of the selections, hold the CONTROL key while clicking.
{ File(s) compiled data view }
Once you click on one or more files under "Recorded Event Files", the compiled information of the file (or an aggregate information of all the files selected in case of multi-selection) appears on the right handside:
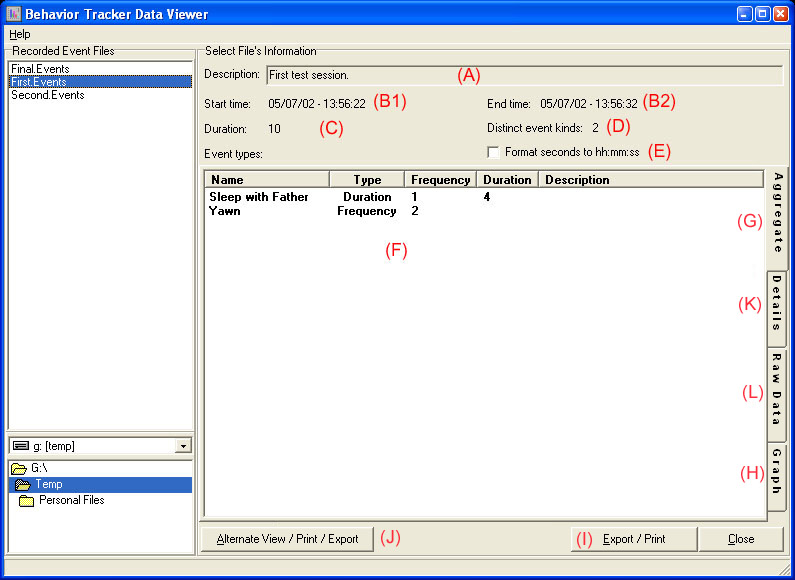
A) This is the session description of the selected file. If no events file is selected, it will display the configuration template's description. Finally, if more than one events file is selected, then a description no longer applies so an N/A is displayed.
B) B1 & B2 are the start and end time stamps for the session. If multiple events files are selected, they display the start of the earliest session and the end of the final session selected.
C) This is the duration of the session in seconds (the number of FULL seconds, 9.9 seconds still shows as 9 seconds though the milliseconds are available in (J)). When (E) is checked, the duration is formatted, otherwise it shows the duration in seconds. If multiple event files are selected, then this is the combined duration of all of them. Note that the total duration may not match the combined amount of mutually-exclusive-always-on events due to millisecond rounding (again more precise information can be found on a lick of (J)). Also, the difference between start and end time might not match total duration for the same reason, or if the session was paused for some time. Finally, if several events were selected, the start and end time may span weeks or months from the first session to the last session while the duration shows the combined number of seconds that the recorder's clock was ticking and behavior was being tracked.
D) Number of distinct behavior types in the selected file(s).
E) If checked, then the total duration and the duration of behaviors in the list are formatted to hours : minutes : seconds. Otherwise the total number of seconds is displayed which is easier to work with for calculation purposes and finding percentages.
F) This area holds the compiled information of each behavior in the selected file(s). So if two files are selected, one with a single sleep session of 5 seconds, and another with two sessions of 10 seconds each, then this area would show sleep with the type "Duration" having occurred 2 times for 15 seconds. Same goes with frequency events.
G) The far right side holds the tabs to switch between the data list display and a graph of the data in the selected file(s).
H) See (G). You can find more on the Graph tab later in this documentation.
I) This button brings up the basic (less pretty but functional on systems where (J) does not work) export and print screen. The information feed to the form that pops up from the press of this button changes depending on which tab on the far right you have selected (if you have the graph tab selected, for example, you'll be exporting or printing the graph).
J) This button opens up a spreadsheet form with the compiled session data of the each file or files selected. The data can then be customized, exported, changed, or printed.
Note: Tabs K & L were added in release 1.2 in order to allow the viewing, printing and exporting the data that was previously available only through the (J) button. That view that the (J) button opens has grid and export objects which require some Microsoft DLL registration files which were not on every one of our user's machines. So we have added the same functionality with out the previous dependencies and moved the original view/export/print to the "J" button.
K) This tab shows the sums of the data for each file selected. This is very useful if you have multiple files and would like to compare the results. What is on this page can then easily be printed our export by using either the (I) or (J) buttons. They provide minor differences on what you can do with the data before exporting and printing.
L) This tab shows all the raw data in all of the files selected. Please note that depending on the size of the files, the number of files selected, and the speed of your computer, this tab could take some time to display its data. What is on this page can then easily be printed our export by using either the (I) or (J) buttons. They provide minor differences on what you can do with the data before exporting and printing.
{ The Graph Tab }
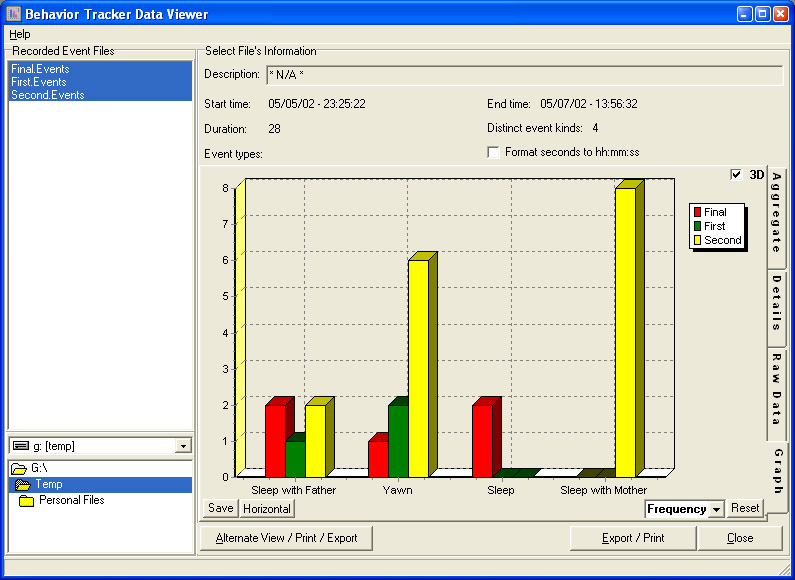
Clicking on the "Graph" tab at the far right side of the screen switches the view to the graph tab:
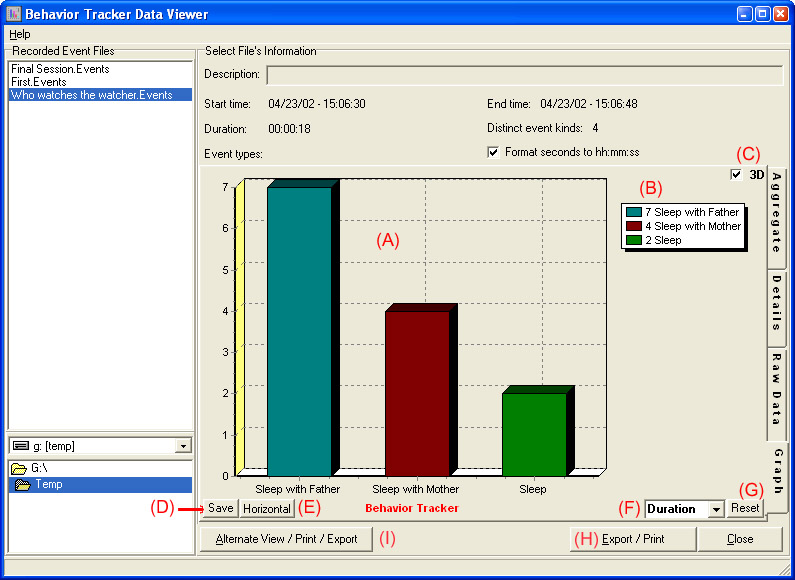
A) The graph automatically sizes and scales to show the legends and all the selected data. You can however right-click and hold the mouse button on the graph and then drag your mouse around to move the graph axis. You can also left-click and hold, and then drag the mouse to create a selection box. When you let go of the left mouse button, the graph will zoom in to the selection box you created. In this fashion you can easily zoom in and center on one or two events of your choice.
B) The legend matches the behavior name and the color on the graph, but it also shows the behavior's statistics. This is done in seconds for behaviors with duration and count for frequency events.
C) Toggles the graph to 2D and 3D mode.
D) As of Version 1.2, this button's functionality has been replaced by button (H) and has been removed.
E) Toggles Horizontal / Vertical graphs.
F) In "Frequency" mode, the frequency of all event kinds is graphed, while when "Duration" is selected, only events with durations are graphed.
G) If you have dragged and zoomed your graph into something you really can't work with or want it back to exactly the way it was when you opened it, "Reset" will do the job.
H) Prints the graph on the selected printer while the Graph tab is selected or saves the graph in several different formats which can be imported into other applications. Using a Meta File format is highly recommended if you plan on importing the graph into a Microsoft product. Note that the "Enhanced" Meta File is a newer/better file format but may not work with older applications. If you have problems with the EMF format, try the WMF format before settling with a BMP.
I) This button opens up a spreadsheet form with the compiled session data of the each file or files selected. The data can then be customized, exported, changed, or printed. As of version 1.2, similar results can be accomplished by selecting the Details and Raw Data tabs and then clicking on the (H) button.
{ Multi-Selection }
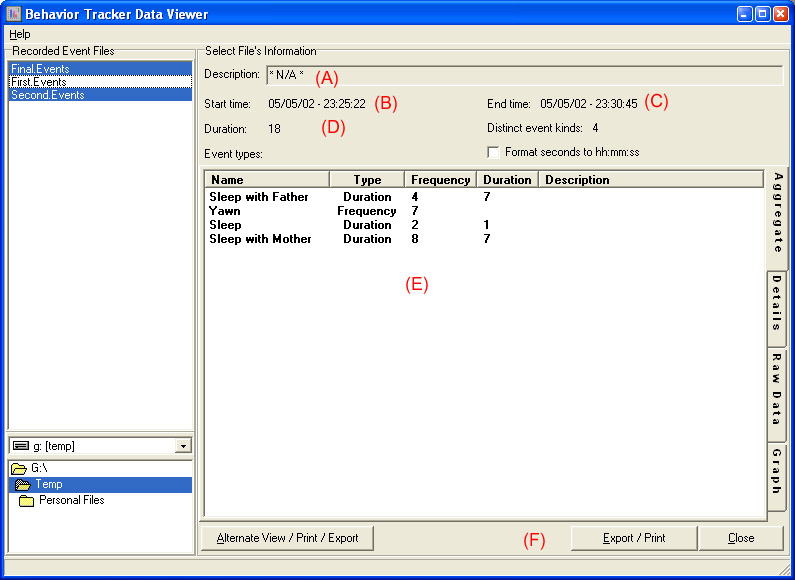
You can multi-select more than one file to view at the same time using normal windows selection methods in the file list under "Recorded Event Files". To select a range, select the first file in the range, hold down the SHIFT key, and click the last one in the range. To select and unselect without changing the rest of the selections, hold the CONTROL key while clicking. Having more than one file open effects every view available on this form. All data presented will be a compilation of all data in all the files selected.
Below we have selected the first and last file in the list using the CTRL key:
The following shows all three files in this list selected using the SHIFT key on the Graph tab:
{ Session Data View / Export }
This button opens up another form which has its own documentation.
{ Tags & Modifiers }
As of version 1.3, you can add tags (also called known as modifiers) to each event while recording (see the Recorder's documentation). This creates a sub-behavior-type category for each different tag. So if, for example, some event of behavior type "Sleep with Father" have tags of "Nest", then all those events with the exact same tag, become their own behavior-sub-type and show up on the viewer as if they were created as a separate behavior-type with the caption "Sleep with Father->Nest".
This allows you to see how often/long the subject slept with its father in their nest or elsewhere as separate behavior types. However, the unique behavior-type ID remains the same in the views and exports, so when looking at the data or on exported data, you can easily combine all behaviors with the same ID together to get combined measures, in this case, how long the subject slept along side of its father regardless of where it happened.
The ability to look at these events as separate behavior-types or as one will hopefully provide enough flexibility to cover most situations.
Please note that tags can be edited, added or removed in the Editor as well as while recording.